
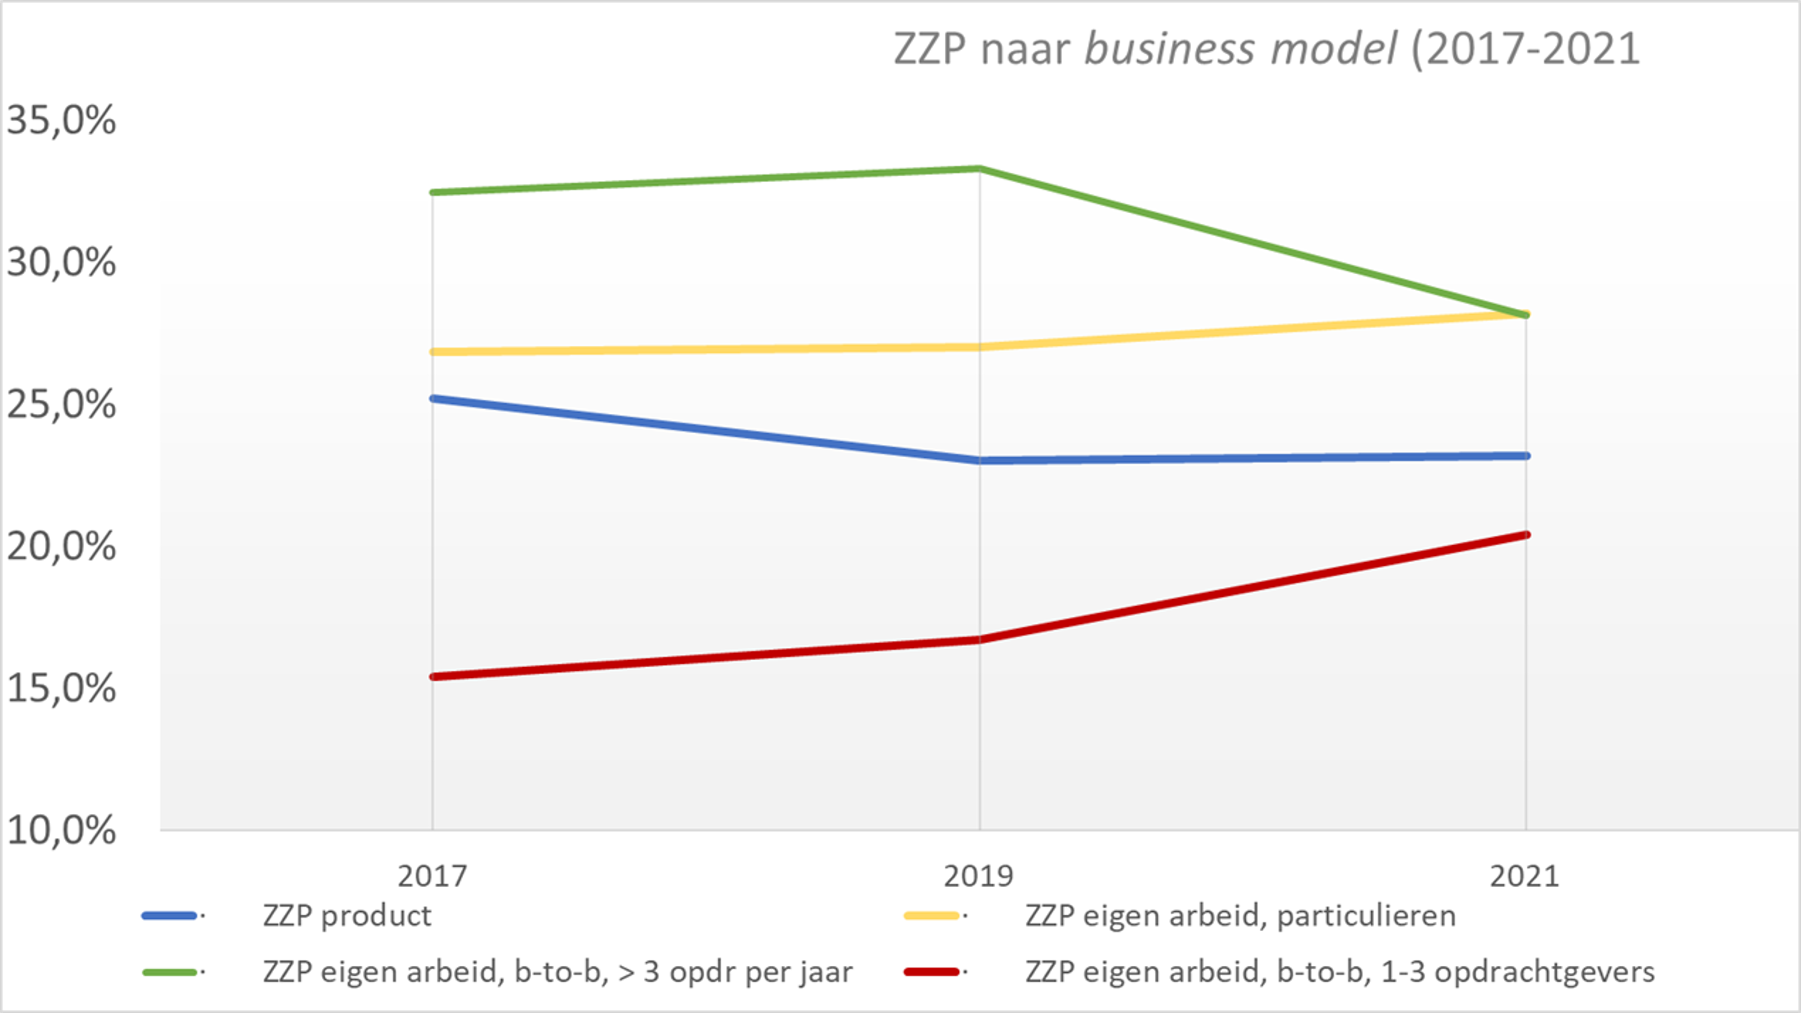
Zzp’ers hebben vaker langlopende opdrachten voor enkele opdrachtgevers. De afgelopen vier jaar steeg het percentage zzp’ers dat eigen arbeid verkoopt aan minder dan drie zakelijke opdrachtgevers met 5 procentpunt.
Van alle typen zzp’ers zijn zelfstandig professionals met enkele opdrachtgevers de kleinste groep. Maar de afgelopen vier jaar is hun percentage flink gestegen. Op dit moment verkoopt 20,4% van alle zzp’ers diensten aan minder dan drie zakelijke opdrachtgevers per jaar. Dat is een stuk hoger dan in 2019 (16,7%) en 2017 (15,4%). Dit blijkt uit het rapport ‘De zzp’er bestaat wél. Feiten over zelfstandigen zonder personeel’ van ZiPconomy in opdracht van HeadFirst en ONL voor Ondernemers. ZiPconomy ontdekte deze trend na analyse van cijfers van de Zelfstandigen Enquête Arbeid (ZEA).
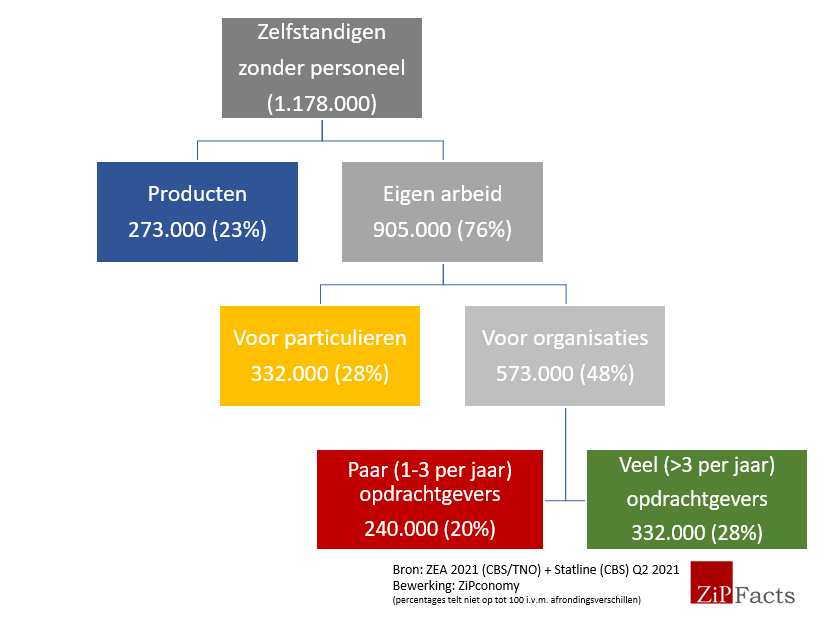
Vier groepen
Beleidsmakers gaan nogal eens voorbij aan de heterogeniteit onder zelfstandigen, bijvoorbeeld bij de vervanging van de wet DBA of de versobering van de zelfstandigenaftrek. Lang niet alle zzp’ers concurreren potentieel met werknemers op de arbeidsmarkt. Een manier om die heterogeniteit inzichtelijk te maken is door de groep zelfstandigen zonder personeel in te delen in vier groepen:
- Zzp’ers die producten verkopen
- Zzp’ers die eigen arbeid (diensten) leveren aan particulieren
- Zzp’ers eigen arbeid, die diensten leveren aan meer dan drie bedrijven of organisaties per jaar.
- Zzp’ers eigen arbeid, die diensten leveren aan drie of minder bedrijven of organisaties per jaar. Ze doen dus vaak wat langere opdrachten bij een opdrachtgever.
Verschuivingen
Er zijn al jaren meer zzp’ers die hun eigen arbeid verkopen dan zelfstandig ondernemers die producten verhandelen. Uit de ZEA’s in de periode 2012-2021 blijkt dat het verschil alleen maar toeneemt: afgelopen jaren steeg het percentage ‘zzp eigen arbeid’ ten opzichte van het percentage ‘zzp producten’. In 2012 verkocht nog 29,5% van alle zzp’ers producten, in 2021 is dat aandeel gedaald naar 23,2%.
Zakelijk, particulier of allebei?
Meer dan drie kwart van de totale groep zzp’ers verkoopt dus eigen arbeid. In 2021 werkte ongeveer 53% van hen uitsluitend voor organisaties (b-to-b), dat percentage is sinds 2012 nagenoeg gelijk gebleven. Dit zijn allerlei types ondernemers: dagvoorzitters, interim-managers, freelance redacteuren bij een krant, zzp-verpleegkundigen in het ziekenhuis, aannemers. In 2012 werkte 29,5% van de zzp’ers eigen arbeid uitsluitend voor particulieren. In 2021 is dat 30,9%. Denk hierbij bijvoorbeeld aan klusjesmannen, schoonmakers of paardrijinstructeurs. In 2012 werkte de overige 18,1% even vaak voor zakelijke klanten als voor particulieren. Dat percentage is in 2021 licht gedaald naar 15,9%. Een voorbeeld zijn yogadocenten die zowel les geven aan particulieren als bedrijfsworkshops verzorgen.
Veel of weinig opdrachtgevers
Er zijn twee soorten zelfstandigen die voor bedrijven en organisaties werken: zzp’ers met veel verschillende klanten en zzp’ers met enkele opdrachtgevers per jaar. De groep met veel opdrachtgevers per jaar werkt vaak kort voor één klant. Denk hierbij aan boekhouders, coaches, dagvoorzitters en logo-ontwerpers. Meestal is bij deze zelfstandigen ook duidelijk dat zij geen werkgever-werknemerrelatie hebben met hun opdrachtgever. Het percentage zzp’ers met meer dan drie opdrachtgevers daalde: 28,2% van alle zzp’ers valt in 2021 deze categorie.
Kleinste groep groeit het hardst
De categorie zzp’ers met een beperkt aantal opdrachtgevers per jaar is procentueel de kleinste groep. Tegelijkertijd is het de groep die momenteel het snelste groeit. Van 2017 tot 2021 is hun aandeel in het totaal aantal zzp’ers met 5 procentpunt gestegen naar 20,4%. Deze zelfstandig ondernemers hebben vaak langer lopende opdrachten voor veel uren per week. Voorbeelden zijn interim-managers, freelance redacteuren van een tv-programma en timmermannen die fulltime werken aan een groot project voor een aannemer. Zzp’ers met zulke langlopende opdrachten worden ook wel ‘zelfstandig interim-professionals’ genoemd. Uit onze analyse blijkt dat deze kleinste groep de afgelopen vier jaar het hardst is gegroeid.
Verklaring
Een mogelijke verklaring voor de stijging is de coronacrisis: langere opdrachten voor meer uur per week geven meer zekerheid. Uit onderzoek van HR-dienstverlener HeadFirst Group en specialist in arbeidsmarktdata Intelligence Group (2021) blijkt dat tijdens de crisis een verschuiving zichtbaar was van uitzenden naar het inhuren van zelfstandigen. Daarnaast groeide het aantal zzp’ers binnen bepaalde beroepsgroepen bovengemiddeld, omdat er tijdens de coronacrisis extra vraag ontstond.
Benieuwd naar meer feiten en cijfers over de zzp’er? Download het rapport ‘De zzp’er bestaat wél. Feiten over zelfstandigen zonder personeel’ van ZiPconomy in opdracht van HeadFirst en ONL voor Ondernemers.